
Drought Impacts
Drought is often associated with High Temperatures, High Evaporation and High Ocean Temperatures. Water shortages and coral bleaching often go along with drought and these are particularly important for small islands and coastal regions with coral geology
Contents
- Coral Bleaching
- Water Scarcity
- Tourism
- Fisheries and Agriculture
- Dengue
- Water borne diseases
- Electricity Generation
Coral Bleaching
Corals are living organisms which add much colour and stunning views. Corals are actually vast colonies of identical polyps. Coral polyps are related to sea anemones and jellyfish. These measure just a few millimeters across but combine to form and act as though it were a single giant organism. Coral reefs contain diverse eco systems, protects the coastlines and provides refuge to many other sea organisms. Heat stress with other factors amount to bleaching where corals will expel the algae (zooxanthellae) living in their tissues causing the coral to turn completely white. Figure 7 illustrates the average coral cover over the past 15 years.
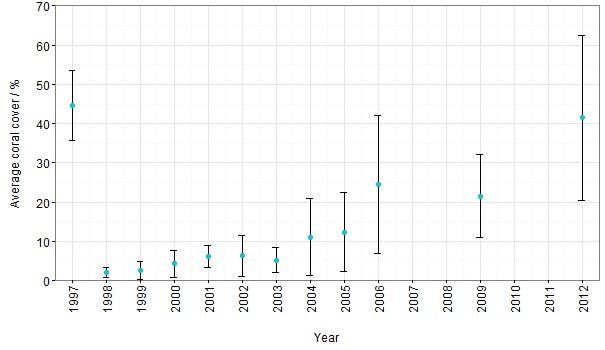
Figure 1 : Average coral cover reported in the literature for Maldives from different sites, showing recovery from the 1998 bleaching event. Coral cover data were extracted from 15 peer reviewed or grey literature articles. The mass mortality of 1998 and subsequent recovery is clearly visible.
Resource : Status of Coral Bleaching in the Maldives 2016-Marine Research Centre - http://www.mrc.gov.mv/
Status of Coral Bleaching in the Maldives 2016-Marine Research Centre
Temperature of sea water and the heat stress it induces has its effect on the bleaching of corals much like on any other organism. When sunlight overexposures the coral the effect is a coral which has been torn away from the algae that depended upon it and also had a symbiotic relationship with the coral.
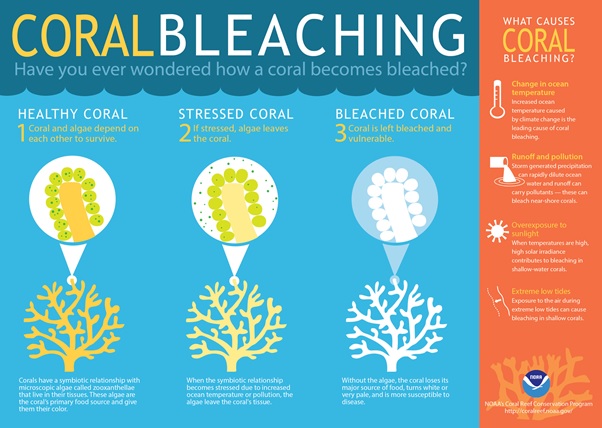
Figure 2 : Coral Bleaching
Resource : National Oceanic and Atmospheric Administration. (https://oceanservice.noaa.gov/facts/coral_bleach.html)
In Figure. 7 we can see the analyses done over three years with comparisons in temperature over the months of average and bleaching threat levels. Different years are compared with different coloured lines. 2016 (dark bold color) displayed the highest thermal stress and the highest number of degree heating weeks, with peak DWH ‘s (Degree Heating Weeks) in May and June 2016. The data were collected by NOAA satellites. In Figure. 8 we can see the comparison of 2015 and 2016 specifically with the red wave of ‘high alert level 1’ experienced in 2016 beginning from April to August. Therefore even if coral cover has recovered as shown above the reality of rising heat temperature over a long time period will also affect the recovering coral in a negative manner.
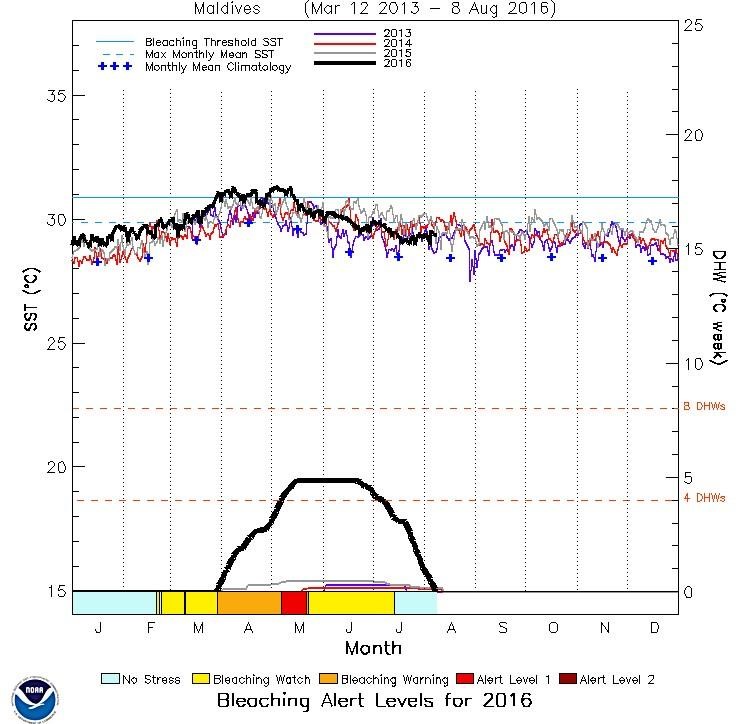
Figure 3 : Degree heating weeks (secondary axis) and thermal stress anomalies for the Maldives for 2013 – 2016.
Resource : Status of Coral Bleaching in the Maldives 2016-Marine Research Centre - http://www.mrc.gov.mv/
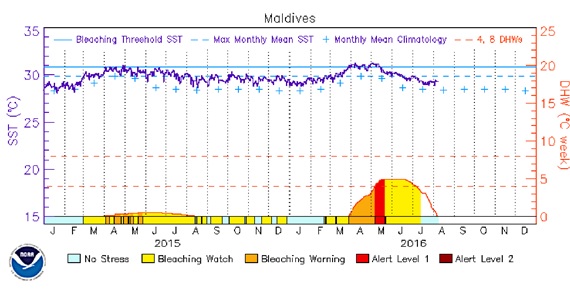
Figure 4 : Daily temperatures in Maldives in 2015 and 2016, as well as the degree heating weeks (secondary axis) and thermal stress anomalies that led to the bleaching event.
Resource : Status of Coral Bleaching in the Maldives 2016-Marine Research Centre - http://www.mrc.gov.mv/
When comparing the areas of North, Central and South of the Maldive islands the bleaching severity is seen less in the North and Southern areas but the condition has become of a more threatening nature in the Central Maldives.
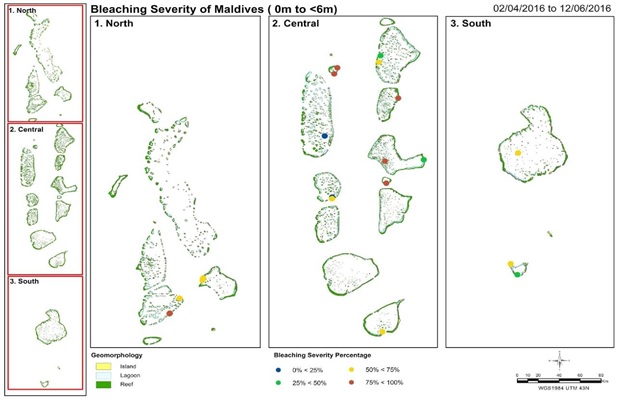
Figure 5 : Bleaching severity from sites surveyed at depths between 0m and 6m throughout the North (1), Central (2) and Southern (3) Maldives. Sites are colour-coded according to bleaching severity among the sites recorded during the survey
Resource : Status of Coral Bleaching in the Maldives 2016-Marine Research Centre - http://www.mrc.gov.mv/
Status of Coral Bleaching in the Maldives 2016-Marine Research Centre
The following diagram Figure 6. shows the areas of the Maldives which have been surveyed at a greater depth and which shows bleaching of 25-50% an (green colour) almost all over the Maldive regions while severe bleaching can be visible in the Central areas. This would suggest that at deeper levels the sea temperature has had its part in the bleaching effect more than the less deeper areas but the less deeper areas have had direct sun exposure as well in process of bleaching.
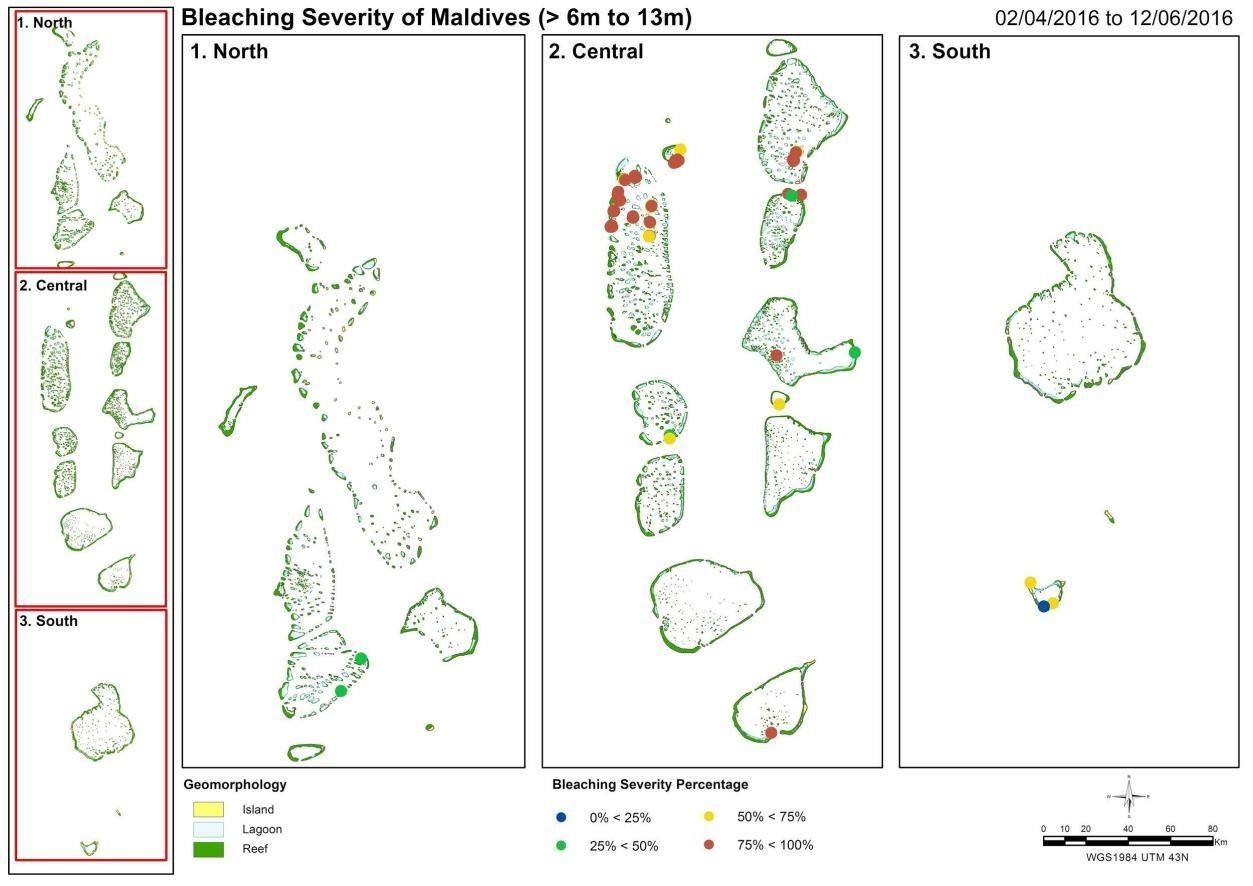
Figure 6 : The sites that were surveyed at depths greater than 6 m down to 13 m throughout the Maldives
Resource : Status of Coral Bleaching in the Maldives 2016-Marine Research Centre - http://www.mrc.gov.mv/
Water Scarcity
The apparent results of high temperature over a long period combined with less than average rainfall leads to the inevitable scarcity of water available for consumption and usage. One main measure of the scarcity of water in a region such as the Maldives where the presence of freshwater lakes, rivers and sources are absent will be the water used for desalination. The other option would be to import water which in the long term will bear large costs and also have its impact on the economy. It does go without saying that Desalination itself will also be a costly venture however the Maldivians as we see below in Figure. 11 have depended on desalination water throughout the past few years.
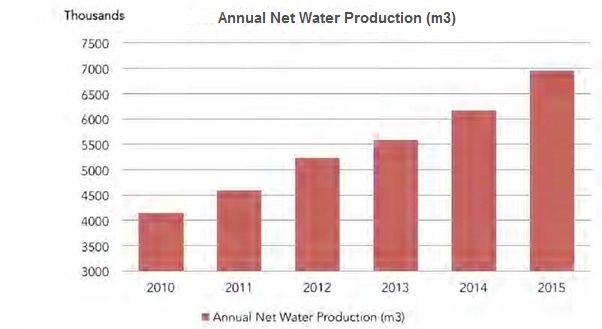
Figure 7 : The net annual water production by MWSC from 2010 to 2015
Source : Male’ Water and Sewerage Company
For an example the following diagramme Figure 8. elaborates further the acuteness of the situation with regard to the scarcity of water. As can be seen from the two right hand columns, the usage of water far exceeds the water demand of the major islands in Greater Male.
| Islands | Population | Annual Rainfall (mm) | ET (mm) | Water usage (Cubic mtrs/day) | Water Demand (Cubic mtrs/day) | Groundwater availability (Cubic mtrs/day) |
|---|---|---|---|---|---|---|
| Male | 114643 | 1660 | 250 | 9400 | 12600 | 8270 |
| Villingili | 7690 | 1660 | 215 | 630 | 840 | 180 |
| Hulhule | 300 | 1660 | 215 | 30 | 30 | 3260 |
| Hulhumale | 3168 | 1660 | 180 | 260 | 350 | 2420 |
Figure 8 : Annual Net Water Production (m3)
Resource : Data provided by: Male’ Water and Sewerage Company (https://www.mwsc.com.mv/)
In Figure 8. we see the above statistics on freshwater availability and requirements. In all four cases the requirement far exceeds the availability of fresh water.
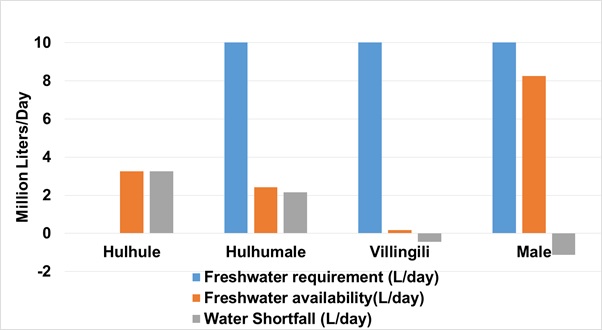
Figure 9 : Freshwater requirement for households in Male, Vilingili, Hulhule and Hulhumale in 2012 without toilet flushing usage
Resource : Data provided by: Male’ Water and Sewerage Company (https://www.mwsc.com.mv/)
Tourism
Tourism in the Maldives is by far the largest economic activity, accounting for 30% of GDP and more than 60% of foreign exchange receipts as seen in Figure 10

Figure 10 : GDP at constant price (million MVR) and growth rate (%).
Data source: Domestic National Product 2010
Owing to the fact that the Maldives with its physical and geographic factors its dependence on the foreign visitor factor is exceptionally vulnerable to climate change and its effect. Furthermore the climatic effects impact the diving coral sites which attract tourists who primarily visit it for that purpose. Another reason for tourist visits had been the beach coasts which have also been somewhat under threat with the rising of sea water levels. This has so far not deterred the tourists from visiting this beautiful environment. For 2016 a 5.7% increase in tourist arrivals was observed as can be seen from Figure 15
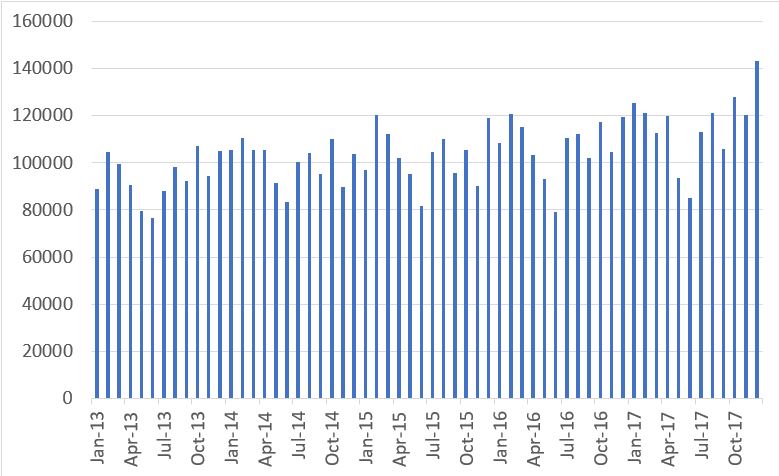
Figure 11 : Maldives tourist arrivals over the past five years
Source: Ministry of Tourism
However we can also observe that there is a decrease in the number of tourists that visited the Maldives for the the above mentioned factors alone Figure 16. This market share is primarily form the European regions while the growth of from the Americas, Africa and Middle East are marginal. While this may not affect the overall tourist visits the culture and destination prospects of the Maldives is been overtaken by the more Asian and Pacific islanders.
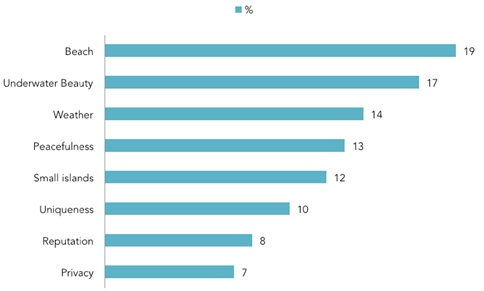
Figure 12 : Reasons for choosing Maldives as a tourist destination.
Data source: (Ministry of Tourism, 2016)
This could also inadvertently affect the income overall since the foreign exchange of the European region is naturally higher than in the Asian regions. The market share by region is illustrated in Figure 13
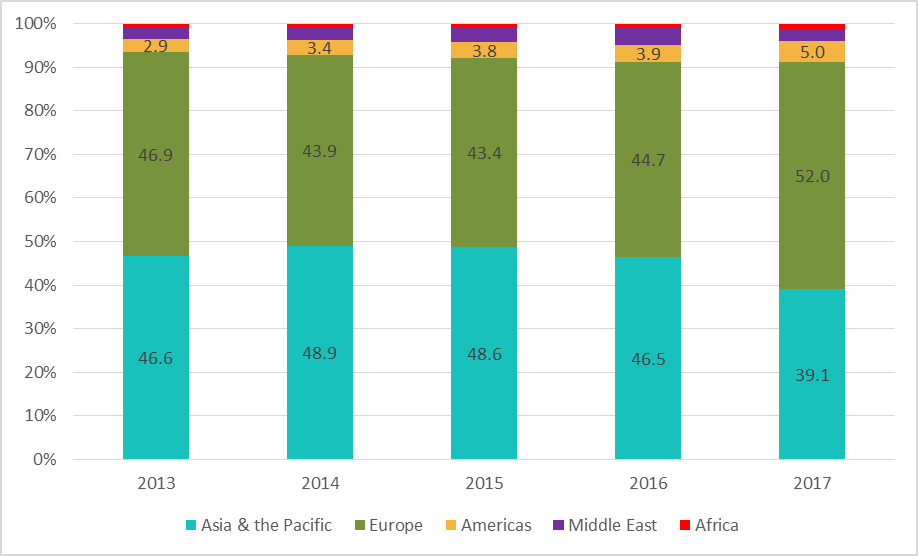
Figure 13 : Tourist arrival market share by region to the Maldives 2013 – 2017
Source - www.tourism.gov.mv http://www.mma.gov.mv/#/statistics
Fisheries and Agriculture
Water availability and Drought conditions affect food security severely. It could even be more severe in islands such as the Maldives since the arable land is largely insignificant food sources are plentifully harvested from the sea which also contributes heavily to the national income. In Figure 16 we can see that both these products have had a steady decline obe the past seven years as its contribution to the GDP has fallen. This would mean that more share has been taken over by industries and services such as tourism. Since the population has not declined we would also suggest that what has declined in the form of fisheries and agriculture now has to be imported which taxes the debt and economic strength of a country.
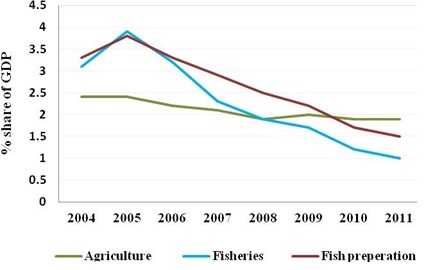
Figure 14 : Percentage shares of GDP
Resource : Ministry of Fisheries and Agriculture (http://www.fishagri.gov.mv/index.php/en/)
In Figure 15, we can see the trends in fish catch, export and consumption. There has not been an impressive increase in the total catch over the years while the exports and the local consumption has also remained the same. There could be a correlation between the sea temperature and the habitat of fish that are usually present in fishing grounds
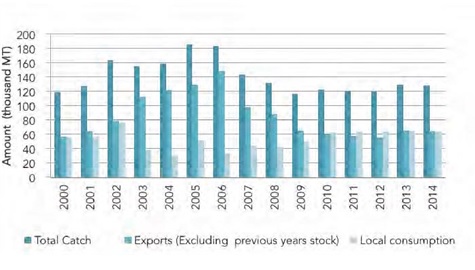
Figure 15 : Trend in catch, export and local consumption
Resource : Fisheries and Aquaculture Department (http://www.fao.org/fishery/en)
As was mentioned above rising sea levels continually threaten the arable land if at all present in the atolls. With this climatic shift such land becomes limited upto the point that food locally produced becomes scarce and this would impact the import factor to a growing population. This is illustrated in Figure 16.
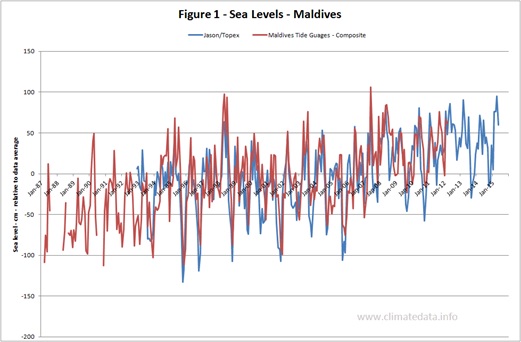
Figure 16 : Sea Level Change
Resource : http://www.climatedata.info/impacts/sea-levels/maldives/
Sea Level Change - Global Sea Level-Tide Guage Data 1807 to 2001. Sea level rise due to climate change threatens the entire country. Estimations are that the projected sea level rise of 0.09 m to 0.88 m is going to take place between 1990 2100. As three quarters of the land area of Maldives is less than a meter above mean sea level, the slightest rise in sea level will prove extremely threatening. As per an estimate, 15 % land area of Male will be inundated by 2025 and 50% by 2100
Dengue
Maldives situated in the tropics is subject to Dengue which is a mosquito borne tropical disease. Dengue is a viral infection transmitted through the bite of infected Aedes aegypti female mosquitoes that feed both indoors and outdoors during the daytime. In 2011 the Maldives experienced the worst dengue outbreaks in its history. This can be seen in Figure 17
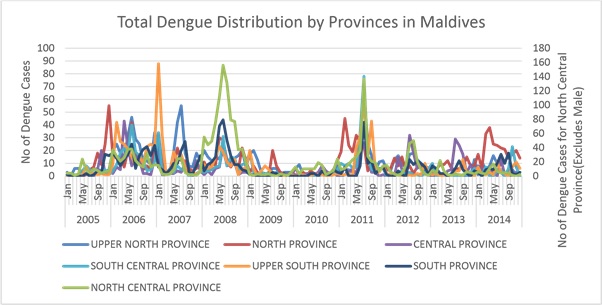
Figure 17 : Total Dengue Distribution by Province in the Maldives from 2005 to 2014
Resource : Maldives Health Protection Agency ( http://www.hpa.gov.mv/English/)
The usual culprit for the spread of Dengue has been noted to be idle water on which the mosquito larvae breeding takes place. The mosquitoes also are very sensitive to the temperature and usually in cooler climates the prevalence of Dengue has been limited. There have been studies http://www.pnas.org/content/108/18/7460.full, and https://www.ncbi.nlm.nih.gov/pmc/articles/PMC3592531/) which associate temperature changes warmer temperature sustenance with the outbreak of this infection. There is the possibility that the prevailing drought conditions did trigger a continuous uninterrupted phase of temperature which was susceptible for mosquito breeding
In Figure 18. we can see the continuance of the Dengue illness which have continued a set pattern. In the Maldives, the temperature from June to August remains very much the same and it is also the time period that Dengue fever is on a sustained rise
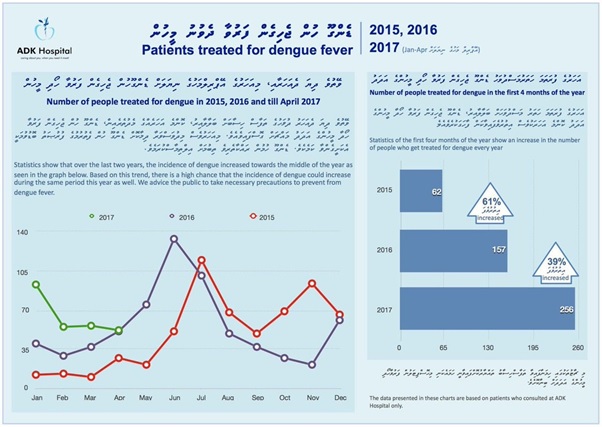
Figure 18 : Patients Treated in 2015 first four months in 2017
Water Borne Diseases
Water borne disease include acute gastro-enteritis (AGE) and typhoid which could be caused by germs in water. Although studies on water-borne diseases in Maldives is limited, the study conducted by Saleem (2012) broadly examined a positive correlation between water related diseases and water security issues. And it has shown a sustained rate of diseases with increases. Figure 19
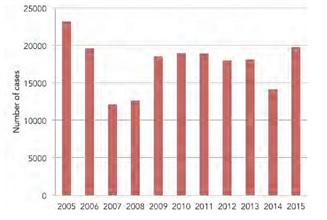
Figure 19 : Incidence of acute gastro-enteritis cases from 2005 to 2015 in Maldives
Source : Health Protection Agency
According to the image, it shows the prevalence of AGE cases from 2005 to 2015 in the Maldives. In Maldives, the number of AGE cases reported annually remained high over the years. In 2015 the incidence of AGE cases showed a 40% increase, compared to the previous year.
Electricity Generation
In the Maldives electricity generation is 100% from fossil fuel combustion (http://www.nationsencyclopedia.com/Asia-and-Oceania/Maldives-ENERGY-AND-POWER.html) . And we can also see that from figure 24 that amount of electricity in demand has been consistently rising even though the chart signifies the Male region it also has the highest population and it simultaneously grows with the years.
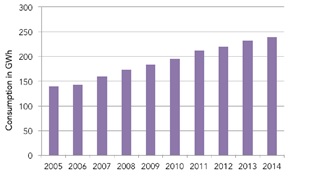
Figure 20 : Electricity consumption for Male’ city from 2005 to 2014.
Source : National Bureau of Statistics, 2015
Coincidently the rise of the price of fossil fuel has also risen through the years and has subsided in the higher levels in last few years. We can see this from figure 21
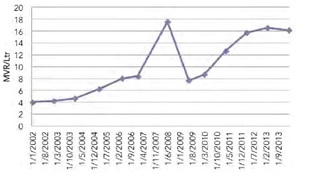
Figure 21 : Changes in open market price of diesel in Maldives from 2002 to 2014
Source : Statistical Yearbooks 2004-2015, National Bureau of Statistics
Both the above stats imply that more electricity is necessary for the us of the Maldives populations. Electricity also has another very important use on the Maldives which is desalination.The Maldives receives the most of its freshwater from rainfall and secondly from groundwater.
The groundwater can be found under every island in what hydrologists call lenses. A lens refers to a curved layer of freshwater that floats on top of a denser layer of saltwater. However, as sea levels rise, groundwater becomes contaminated and salinized. Certain estimates state that if sea levels rise by one meter, it will reduce the capacity for groundwater by as much as 79%. (https://borgenproject.org/infrastructure-water-quality-in-the-maldives)
In that regard when there is an over-exploitation of the aquifers in the the smaller islands there is a dire need to depend on desalination and a severe water crisis in December 2014 was initiated when a fire broke out in their largest reverse osmosis plant.
As we can see from Figure 22 electricity expenditure is related to the issues that arise in times of a drought condition as electricity generation has to be for used for desalination tasks as well.
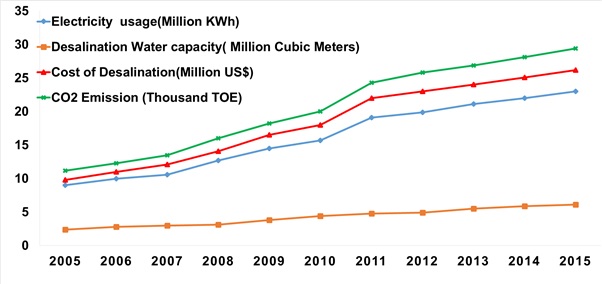
Figure 22 : Desalinated water capacities at Maldives Water and Sewerage Company and related energy consumption
Source : Ministry of Environment and Energy (http://www.fao.org/fishery/)