Scientific Background on the Indian Ocean Earthquake and Tsunami


Summary

Information relating to the submarine earthquake inbetween Aceh, Indonesia and Sri Lanka of the 26th of December, 2004 has been compiled here. This compilation archives much of the readily available scientific information. I was able to actually see the devastation of the Tsunami during a three week visit to Sri Lanka (See http://lareef.blogspot.com/).

 Aspects that were not immediately brought out by news reports were:
  • The 9.0 Earthquake at 6.58 hours at the epicenter (and in Sri Lanka) led to a sequence of 15 quakes across the Andaman region.
  • While earthquakes could not be predicted in advance, once the earthquake was detected it was possible to give about 3 hours of notice of a potential Tsunami. Such a system of warnings is in place across the Pacific Ocean but not in the Indian Ocean. In addition, coastal dwellers are educated in the Pacific littoral to get to high ground quickly following tremors and waves. 
  • Tsunamis are rarer in the Indian Ocean as the seismic activity is less than in the Pacific. There have been 7 records of Tsunamis set off by Earthquakes near Indonesia, Pakistan and one at Bay of Bengal in the last century.
  • Earthquakes occur when any of the 12 or 13 tectonic plates collide at their boundaries. The present collision is due to compression between the Indian and Burmese plates. The initial eruption happened near the location of the meeting point of the Australian, Indian and Burmese plates. Scientists have shown that this is a region of compression as the Australian plate  is rotating counterclockwise into the Indian plate. This means that the region of seismic activity has become extended extending in a region in the South Eastern Indian Ocean.
  • Tsunamis are not entirely unknown in the Indian Ocean.  For example, the Tsunami in 1883 generated by the Volcanoes at Krakatoa led to a surge of at least 1 m in Sri Lanka. The damage was much less then.
  • Once the large amount of pent-up energy in the compression zones of the plate boundaries have been released, it takes another buildup of energy for another event of similar magnitude. This is unlikely in the short-term. However, in the future, Indian Ocean littoral regions should generate and pay attention to earthquake and tsunami warnings.
  • Early warning is only one part of disaster risk management, disaster preparedness, vulnerability reduction and post-disaster relief and reconstruction. We are providing information resources for relief and reconstuction in Sri Lanka in the first instance.   Also see my blog,  recoverlanka.net and geolanka.net .

Contents:
  1. Tsunami Animation
  2. Lamont Doherty Seismographs for 25th and 26th December 2004
  3. Records from the US Geological Survey
  4. USGS: Warning System Could have Saved Thousands
  5. USGS: Background on the Earthquake
  6. World Seismic Activity from the Global Seismic Assessment Program
  7. Compression near the Boundaries of the Indian, Burma and Australia Plates
  8. Tsunamis affecting South Asia
  9. Tsunamis affecting Indian Coastlines
  10. 1883 - Reports from Ceylon on the Tsunami
  11. 1941 Tsunami in the Bay of Bengal
  12. Indian Ocean Currents During January
  13. Disaster Preparedness Forecasting and Warning for Tsunamis
  14. Background Information and Disaster Management Resources
  15. Link to Disaster Links from Relief Web
  16. Links to the Last Major Disaster in Sri Lanka - May 2003 Flooding

Compiled by Lareef Zubair,
Sri Lanka Meteorology, Oceanography and Hydrology Network and
The Earth Institute at Columbia University,
lareef@ldeo.columbia.edu
1-845-680-4424
last updated 28th December, 2004


An  earthquake that measured 8.9 on the Richter Scale of the West Coast on Northern Sumatra set off a series of other earthquakes lasting 12 hours on the 26th of December (from 00:58 to 11:05 UTC), 2004 led to widespread catastrophe particularly in Sri Lanka, India, Maldives, Indonesia and Thailand with damage also in Malaysia, Bangladesh, Somalia and Seychelles.
For background information with maps, statistics and other resources useful for relief and reconstruction, please see the following site which is now focussed on Sri Lanka.
Earthquake and Tsunami Disaster Relief and Reconstuction
Information on other affected regions shall follow.

Tsunami Animation: Courtesy: National Institute of Advanced Industrial Science and Technology, Japan

Animation of Tsunami
Lamont Doherty Seismographs for 25th and 26th December 2004.

The seismographs at Lamont Doherty Earth Observatory at Columbia University in New York, USA shows that at around 1.20 am GMT on the December 26th, there was extraordinary oscillations  that subsided 12 hours later.  The seismograph for the previous day too is shown showing regular activity.  The LDEO seismogrpahs goes off the chart around 01:20 GMT and then subsides by 06:45 GMT. However, things do not become normal until 15:00 GMT.

(http://www.ldeo.columbia.edu/cgi-bin/LCSN/WebSeis/24hr_heli.pl )

LDEO Seismography 25 December, 2004
LDEO Seismography December 26, 2004


Records from the US Geological Survey

The earth quake location and magnitude as recorded by the US Geological Services Earth Quake Network provided the sequence of Earthquakes with those in Red being above 6.0 in the Richter Scale.
http://earthquake.usgs.gov/recenteqsww/Quakes/quakes_all.html

    MAG    DATE     UTC-TIME    LAT     LON    DEPTH    region
y/m/d h:m:s deg deg km

MAP 6.3  2004/12/26 11:05:01  13.542   92.877  10.0  ANDAMAN ISLANDS, INDIA REGION
MAP 6.2 2004/12/26 10:19:30 13.455 92.791 10.0 ANDAMAN ISLANDS, INDIA REGION
MAP 6.5 2004/12/26 09:20:01 8.867 92.382 10.0 NICOBAR ISLANDS, INDIA REGION
MAP 5.8 2004/12/26 07:38:25 13.119 93.051 10.0 ANDAMAN ISLANDS, INDIA REGION
MAP 5.7 2004/12/26 07:07:10 10.336 93.756 10.0 ANDAMAN ISLANDS, INDIA REGION
MAP 5.7 2004/12/26 06:21:58 10.623 92.323 10.0 ANDAMAN ISLANDS, INDIA REGION
MAP 7.3 2004/12/26 04:21:26 6.901 92.952 10.0 NICOBAR ISLANDS, INDIA REGION
MAP 6.1 2004/12/26 03:08:42 13.808 92.974 10.0 ANDAMAN ISLANDS, INDIA REGION
MAP 5.9 2004/12/26 02:59:12 3.177 94.259 10.0 OFF THE WEST COAST OF NORTHERN SUMATRA
MAP 6.0 2004/12/26 02:51:59 12.511 92.592 10.0 ANDAMAN ISLANDS, INDIA REGION
MAP 5.8 2004/12/26 02:36:06 12.139 93.011 10.0 ANDAMAN ISLANDS, INDIA REGION
MAP 5.8 2004/12/26 02:34:50 4.104 94.184 10.0 OFF THE WEST COAST OF NORTHERN SUMATRA
MAP 6.0 2004/12/26 02:22:02 8.838 92.532 10.0 NICOBAR ISLANDS, INDIA REGION
MAP 5.8 2004/12/26 02:15:58 12.375 92.509 10.0 ANDAMAN ISLANDS, INDIA REGION
MAP 5.9 2004/12/26 01:48:47 5.393 94.423 10.0 NORTHERN SUMATRA, INDONESIA
MAP 8.9 2004/12/26 00:58:51 3.298 95.779 10.0 OFF THE WEST COAST OF NORTHERN SUMATRA


The Pacific Tsunami Warning Center Detected the Earthquake
and after 15 minutes issued a communique to Pacific Islands saying that there shall be no threats to them and
also advises that there is a Tsunami watch going on but not an alert.
65 minutes later a second communique repeats the same information and says that there may a possibility of
a Tsunami at the epicenter
http://www.prh.noaa.gov/ptwc/olderwmsg

The tragedy is that this information was not communicated to the Indian Ocean region. The NOAA officers says that they did not
have the addresses of the appropriate officials.


**************************************************************


TSUNAMI BULLETIN NUMBER 002
PACIFIC TSUNAMI WARNING CENTER/NOAA/NWS
ISSUED AT 0204Z 26 DEC 2004

THIS BULLETIN IS FOR ALL AREAS OF THE PACIFIC BASIN EXCEPT
ALASKA - BRITISH COLUMBIA - WASHINGTON - OREGON - CALIFORNIA.

.................. TSUNAMI INFORMATION BULLETIN ..................

ATTENTION: NOTE REVISED MAGNITUDE.

THIS MESSAGE IS FOR INFORMATION ONLY. THERE IS NO TSUNAMI WARNING
OR WATCH IN EFFECT.

AN EARTHQUAKE HAS OCCURRED WITH THESE PRELIMINARY PARAMETERS

ORIGIN TIME - 0059Z 26 DEC 2004
COORDINATES - 3.4 NORTH 95.7 EAST
LOCATION - OFF W COAST OF NORTHERN SUMATERA
MAGNITUDE - 8.5

EVALUATION
REVISED MAGNITUDE BASED ON ANALYSIS OF MANTLE WAVES.
THIS EARTHQUAKE IS LOCATED OUTSIDE THE PACIFIC. NO DESTRUCTIVE
TSUNAMI THREAT EXISTS FOR THE PACIFIC BASIN BASED ON HISTORICAL
EARTHQUAKE AND TSUNAMI DATA.

THERE IS THE POSSIBILITY OF A TSUNAMI NEAR THE EPICENTER.

THIS WILL BE THE ONLY BULLETIN ISSUED FOR THIS EVENT UNLESS
ADDITIONAL INFORMATION BECOMES AVAILABLE.

THE WEST COAST/ALASKA TSUNAMI WARNING CENTER WILL ISSUE BULLETINS
FOR ALASKA - BRITISH COLUMBIA - WASHINGTON - OREGON - CALIFORNIA.


**************************************************************

USGS: Warning System Could have Saved Thousands

There is no warning system in place for Tsunamis in the Indian Ocean. If there had been such a warning system then alarm could have been raised 20 minutes to 2 hours in advance.
http://news.yahoo.com/news?tmpl=story&u=/nm/20041226/us_nm/quake_usa_warnings_dc_4

USGS: Warnings Could Have Saved Thousands in Asia - 26 December, 2004

WASHINGTON (Reuters) - A warning center such as those used around the Pacific could have saved most of the thousands of people who died in Asia's earthquake and tsunamis, a U.S. Geological Survey official said on Sunday.
 
None of the countries most severely affected -- including India, Thailand, Indonesia and Sri Lanka -- had a tsunami warning mechanism or tidal gauges to alert people to the wall of water that followed a massive earthquake, said Waverly Person of the USGS (news - web sites) National Earthquake Information Center.

"Most of those people could have been saved if they had had a tsunami warning system in place or tide gauges," he said.

"And I think this will be a lesson to them," he said, referring to the governments of the devastated countries.

Person also said that because large tsunamis, or seismic sea waves, are extremely rare in the Indian Ocean, people were never taught to flee inland after they felt the tremors of an earthquake.

Tsunami warning systems and tide gauges exist around the Pacific Ocean, for the Pacific Rim as well as South America. The United States has such warning centers in Hawaii and Alaska operated by the U.S. Geological Survey. But none of these monitors the Indian Ocean region. The 8.9-magnitude underwater quake -- one of the most powerful in history -- off the Indonesian island of Sumatra devastated southern Asia and triggered waves of up to 30 feet high.

DEVASTATING TSUNAMI

U.S. seismologists said it was unlikely the Indian Ocean region would be hit any time soon by a similarly devastating tsunami because it takes an enormously strong earthquake to generate one.

"That's really what has created all of these problems -- is that the earthquake is just so massive," said Dan Blakeman, a USGS earthquake analyst.

But Person said governments should instruct people living along the coast to move after a quake. Since a tsunami is generated at the source of an underwater earthquake, there is usually time -- from 20 minutes to two hours -- to get people away as it builds in the ocean. "People along the Japanese coasts, along the coasts of California -- people are taught to move away from the coasts. But a lot of these people in the area where this occurred -- they probably had no kind of lessons or any knowledge of tsunamis because they are so rare."

A major tsunami, a Japanese word meaning "harbor wave," occurs in the Pacific Ocean about once a decade. It is generated by vertical movement during an earthquake and sometimes incorrectly referred to as a tidal wave, according to the Web site of the U.S. National Geophysical Data Center.

Because of the lack of monitoring mechanisms, the U.S. Geological Survey had no access to government or scientific information in the areas affected by the latest tsunamis.
"I've been talking to our tsunami people and they have no contact with any of these nations on the tsunamis," said Person. "We don't have anyone there. We get it from the press."


USGS: Background on the Earthquake

Background on the 9.0 Earthquake from the US Geological Survey
http://earthquake.usgs.gov/eqinthenews/2004/usslav/


26th of December, 2004
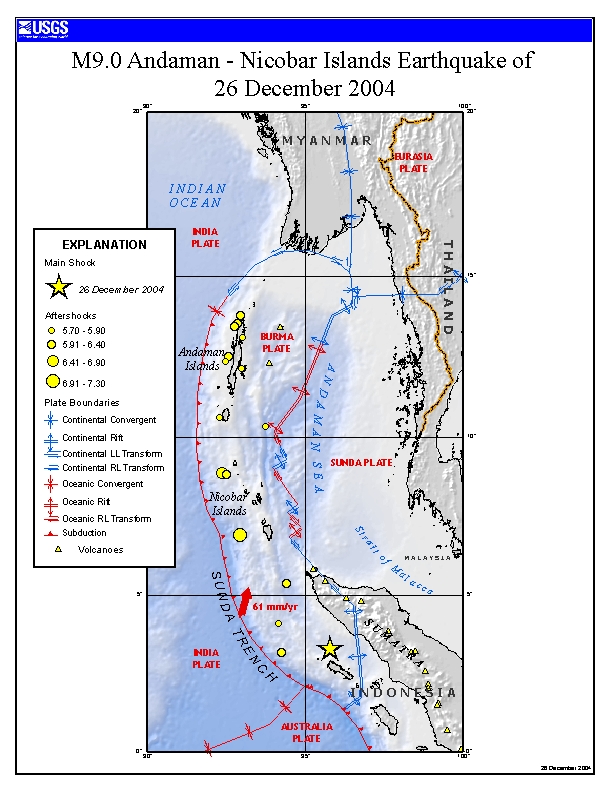
Today's shallow, thrust-type earthquake occurred off the west coast of northern Sumatra at the interface between the India and Burma plates. In this region, the Burma plate is characterized by significant strain partitioning due to oblique convergence of the India and Australia plates to the west and the Sunda and Eurasian plates to the east. Off the west coast of northern Sumatra, the India plate is moving in a northeastward direction at about 5 cm per year relative to the Burma plate. Preliminary locations of larger aftershocks following today's earthquake show that approximately 1000 km of the plate boundary slipped as a result of the earthquake. Aftershocks are distributed along much of the shallow plate boundary between northern Sumatra (approximately 3 degrees north) to near Andaman Island (at about 14 degrees north).


27th December, 2004
The devastating megathrust earthquake of December 26th, 2004 occurred on the interface of the India and Burma plates and was cause by the release of stresses that develop as the India plate subducts beneath the overriding Burma plate. The India plate begins its decent into the mantle at the Sunda trench which lies to the west of the earthquake's epicenter. The trench is the surface expression of the India-Burma plate interface.

The tectonics of the region is complex and involves the interaction of the Australian, Sunda and Eurasian plates in addition to the India and Burma plate. The India and Australia plates move northeastwards at a rate of about 6 cm/year relative to the Burma plate. This results in oblique convergence at the Sunda trench. Some of this oblique motion is accommodated on the right-lateral transform faults and rifts that separate the Burma and Sunda plates.

Preliminary locations of larger aftershocks following the megathrust earthquake show that approximately 1000 km of the plate boundary slipped as a result of the earthquake. Aftershocks are distributed along much of the shallow plate interface and primarily extend northwards of the epicenter to the Andaman Islands.

The worlds largest recorded earthquakes were all megathrust events and occur where one tectonic plate subducts beneath another. These include: the magnitude 9.5 1960 Chile earthquake, the magnitude 9.2 1964 Prince William Sound, Alaska earthquake, the magnitude 9.1 1957 Andreanof, Alaska earthquake, and the magnitude 9.0 1952 Kamchatka earthquake. As with the recent event, megathrust earthquakes often generate large tsunamis that can cause damage over a much wider area than is directly effected by ground shaking near the earthquake's rupture.


India-Burma Plate


World Seismic Activity from the Global Seismic Assessment Program

The earthquake took place in a region with previous earthquake activity as shown in the map prepared by the
The Global Seismic Hazard Assessment Program (GSHAP)  in the framework of the United Nations International Decade for Natural Disaster Reduction (UN/IDNDR). The present earthquake took place in a seismically active region at the plate boundary separating the Indian-Australian and East-Asian Plates.  There are 12 plates in the world and earthquakes occur when these collide. A 13th plate was created by the breakup of the Indo-Australian plate was documented in 1995. This breakup has set up compression zone near
Northern Sumatra.
Seismic Activity in the World

The spatial density of strong earthquakes around the Earth

The density of earth quakes has been estimated by the USGS (http://neic.usgs.gov/neis/density/eq_density.html )  as

Global Earth Quake Density


Compression near the Boundaries of the Indian, Burma and Australia Plates

James Van Orman, Jim Cochran, Jeff Weisel and Florence Jestin  and others of Lamont Doherty Earth Observatory have argued lately that the Indo-Australian plate is breaking up into two due to extraordinary stresses that have been set up and stretching in the India. Their paper was published in Earth and Planetary Science Letters in 1995. See "An Earth Plate is Breaking into Two"
http://www.columbia.edu/cu/pr/95/18688.html
Link to paper

The counter-clockwise rotation of the new Australian plate in relation to the Indian Plate has led to compression in the Eastern boundary near Indonesia and tension in teh Western part of the new plate. The series of earth quakes that took place were on teh eastern boundary of the new plate.

Scientists at Columbia University's Lamont-Doherty Earth Observatory report direct evidence that one of the Earth's great crustal plates is cracking in two - 1995.

In a report published in the most recent issue of Earth and Planetary Science Letters (vol. 133), the scientists say they have confirmed that the Indo-Australian Plate--long identified as a single plate on which both India and Australia lie--appears to have broken apart just south of the Equator beneath the Indian Ocean. The break has been underway for the past several million years, and now the two continents are moving independently of one another in slightly different directions.

Scientists have known that for some 50 million years, the Indian subcontinent has been pushing northward into Eurasia, forcefully raising the Tibetan Plateau and the Himalayan Mountains. The new research suggests that starting about 8 million years ago, the accumulated mass became so great that the Indo-Australian Plate buckled and broke under the stress.

"The result of this critical stage in the collision between India and Asia is the breakup of the Indo-Australia Plate into separate Indian and Australian plates," Jeffrey Weissel, a scientist at Lamont-Doherty, Columbia's earth sciences research institute in Palisades, N.Y., said in an interview.

"In the Central Indian Ocean, Nature is conducting a large-scale laboratory experiment for us, showing us what happens to the oceanic lithosphere (Earth's outer layer) when force is applied," Dr. Weissel said in an interview. Essentially pushed into an immovable object, "it can buckle like a piece of tin," he said.

A fundamental tenet of plate tectonics theory is that the Earth's surface is divided into rigid plates that move together and apart like pieces of a jigsaw puzzle. Scientists have long recognized 12 major plates. Now there are 13. In the 1970's, scientists first discovered a broad zone, stretching more than 600 miles from east to west where the equatorial Indian Ocean floor was compressed and deformed. Drilled samples had shown that the zone had begun to buckle and crack about 8 million years ago at the same time that the Tibetan Plateau had reached its greatest height. Dr. Cochran was chief scientist of the drilling cruise that collected this data.

More recently, researchers at Northwestern University, led by Richard Gordon and Seth Stein, used data on how newly created seafloor had spread outward from mid-ocean ridges to the west and south of the deformed region in the Indian Ocean. They theorized that the movements of the newly created seafloor could be accommodated only if a distinct plate boundary existed between separate Indian and Australian plates across the equatorial Indian Ocean.

In relation to the Indian plate, the Australian Plate is moving counterclockwise, the Northwestern University scientists calculated. In the western part of the new plate boundary, the plates are moving away from each other. To the east, the Australian Plate is converging on the Indian Plate, they said. If the theory was correct, the ocean floor in the eastern part of the new plate boundary should be compressed, buckled, cracked and eventually thrust upward along the cracks. More critically, if a separate Australian Plate were rotating counterclockwise in relation to a separate Indian Plate, the amount of compression should increase rapidly and systematically from west to east across the Central Indian Ocean. <>To test the theory, the Lamont-Doherty team took actual measurements of how compressed the Indian Ocean floor has become in the region believed to be the new plate boundary. Using sound waves to probe oceanic rock layers, they created images of subseafloor structures.

The images were collected during two separate research voyages that each spanned the entire deformed zone from north to south. Dr. Weissel and Dr. Jestin were aboard the 1991 "Phedre" cruise of the French research vessel Marion Dufresne. In 1986, Lamont-Doherty's former research vessel, the Robert D. Conrad, obtained images along a north-to-south line 185 miles farther west. <>The images showed scores of systematically aligned cracks, or faults, in the oceanic lithosphere--created as the once-whole plate buckled and cracked. As the now-distinct plates continued to converge, slabs of ocean floor slid upward along the faults to alleviate the strain. The more the two plates converged, the farther the slabs slid upward. The measurements clearly showed that two separate plates were converging. More importantly, the thrusting observed on the "Phedre" seismic line was about twice that found along the Conrad's line. That proved that compression was more intense to the east--confirming the Northwestern group's prediction from the data on spreading rate and direction at the mid-ocean ridges.

 
 Tsunamis affecting South Asia
There have been 7 Tsunamis recorded in the Indian Ocean in the last 200 years. Out of these the 1941 Tsunami was the most dramatic.

South Asian Tsunamis  (Pronounced: Sue-Naa-Me)
See the Amateur Seismic Network
http://asc-india.org/menu/waves.htm

The infamous offspring of undersea earthquakes, tsunamis conjour images of towering waves such as those depicted in this Japanese wood cut, whose name. when translated means "In the hollow of the Great Wave off the coast of Kanagawa". Part of a set of  36 views of Mount Fuji, renowned Edo-era painter, Katsushika Hokusai depicts a mammoth wave that dwarfs Fujiyama in the back. Though towering waves rarely accompany

tsunamis, they are an immediate secondary threat to coastal and low-lying communities following offshore or coastal earthquakes. The word "Tsunami" is Japanese for "Harbour Wave". They are often wrongly called "Tidal Waves" and have nothing to do with tides. Most are generated by shallow earthquakes in the sea or by temblors near the coast that can set off underwater landslides. Volcanic eruptions scan also cause tsunamis.

Causes of Tsunamis
Shallow undersea earthquakes are responsible for most tsunamis though at time landslides triggered by smaller seismic events can also generated potentially lethal waves. Strong earthquakes cause a displacement of the crust. When they occur underwater, this crustal movement disturbs a large volume of water like a giant paddle and ripples spread out in all directions at speeds of 600-800 kilometres per hour, comparable to commercial aircraft. In the open ocean, they go unnoticed but once they reach shallower waters they slow down and begin to crest. The waves thus given rise to are known as "Tsunamis".  They are scientifically described as a series of very long wavelength ocean waves caused by the sudden displacement of water by earthquakes, landslides, or submarine slumps and are mostly caused by earthquakes of magnitude 7.5 or greater. The run-up of a tsunami is the maximum height above normal sea level up to which the water level rose during a tsunami.

Date

Location

1524

Near Dabhol, Maharashtra

02 April 1762

Arakan Coast, Myanmar

16 June 1819

Rann of Kachchh, Gujarat

31 October 1847

Great Nicobar Island

31 December 1881

Car Nicobar Island

26 August 1883

Krakatoa volcanic eruption

28 November 1945

Mekran coast, Balochistan

Major Tsunamis in South Asia
Though rare and relatively unheard of, tsunamis have struck the shores of South Asia in the past. The deadliest was in 1945 which originated off the
Mekran coast in Pakistan and caused deaths as far as Mumbai. In earliest known tsunami occurred in the Bay of Bengal in 1762, caused by an earthquake on Myanmar's,  Arakan Coast.


Tsunamis affecting India

TSUNAMIS ON THE COAST LINES OF INDIA

T. S. Murty
Baird and Associates Coastal Engineers
Ottawa, Canada
A. Bapat
Sadashiv Peth, Puna, India

Although the majority of the reported tsunamis are from littoral countries of the Pacific Ocean, there are a few cases of tsunamis in the Indian Ocean. The approximate length of the Indian coast is about 6000 kilometers. The coasts run from north to south and have two arms in the east and west with a tapering end at Kanyakumari. The tsunamigenic earthquakes occur mostly at the following three locations; (1) The Andaman sea, (2) Area about 400-500 kilometers SSW of Sri Lanka (Ceylon), (3) The Arabian Sea about 70-100 kilometers south of Pakistan Coast -- off Karachi and Baluchistan. The oldest record of tsunami is available from November 326 BC earthquake near the Indus delta/Kutch region. Alexander the Great was returning to Greece after his conquest and wanted to go back by a sea route. But an earthquake of large magnitude destroyed the mighty Macedonian fleet as reported by Lietzin (1974).

The earliest record of tsunami is reported to be about 1.5 meters at Chennai (formerly Madras) which was created due to the August 8, 1883 Krakatoa volcanic explosion in Indonesia. An earthquake of magnitude 8.25 occurred about 70 kilometers south of Karachi (Pakistan) at 24.5 N and 63.0 E on November 27, 1945. This created a large tsunami of about 11.0 to 11.5 meters high on the coasts of India in the Kutchch region, as reported by Pendse (1945). An earthquake of magnitude 8.1 occurred in the Andaman Sea at 12.9 N and 92.5 E on June 26, 1941 and a tsunami hit the east coast of India. As per non-scientific/journalistic sources, the height of the tsunami was of the order of 0.75 to 1.25 meters. At the time no tide gauge was in operation. Mathematical calculations suggest that the height could be of the order of 1.0 meter. There are a few more cases of earthquakes of magnitude less than 8.0 which have given rise to some smaller tsunamis. Bapat, et al (1983) have reported a few more earthquakes on the coast of Myanmar (formerly Burma).


1941 Tsunami in the Bay of Bengal
The Tsunami of 1941 following an earthquake in the Bay of Bengal was detected in Sri Lanka and was reported on  as follows
  The Tsunami of 1941 following an earthquake in the Bay of Bengal was detected in Sri Lanka 
from Amateur Seismic Network
http://asc-india.org/menu/

It was reported on  as follows
1941 - Andaman Islands, India, Mw 7.7
Date
     26th June 1941
Epicentre:
     20.5 kilometres W of Flat Island, India
Latitude:
     12.500o N (5)
Longitude:
 92.570o E (5)
Origin Time:
     11:52:03 UTC (5)
Magnitude:
     Mw 7.71 (3), Mb 8.0 (4), Ms 7.7 (4)
Moment:
 4.25*10*20 Nm (3)

The earthquake of June 26, 1941 is among the strongest earthquakes ever recorded in the Andaman & Nicobar Islands. It had a magnitude of 7.7 (Mw).

It was centred (5) in the Bay of Bengal, roughly, 20.5 kilometres W of Flat Island, India
or 23.6 kilometres WNW of Yadita (Middle Andaman Isl.), India,
or 96.7 kilometres NNW of Port Blair (South Andaman Island), India,
or 617 kilometres SW of Yangon, Myanmar,
or 834 kilometres NNW of Banda Aceh (Sumatera), Indonesia.

It was the last great earthquake in the Andaman and Nicobar Islands. The 1881 Nicobar Islands earthquake (M7.9) is the only other event of comparable magnitude.

This 1941 earthquake caused widespread damage on Middle and South Andaman Islands. Most masonry structures in and around Port Blair were badly affected. The Cellular Jail which was a 3 storey building with 696 solitary cells and infamous for the imprisonment, torture and murder or freedom fighters, including Vinayak D. Savarkar was destroyed as were all the elegant buildings and wide roads, on Ross Island, the administrative centre of the British. The maximum intensity (4) was experienced at Baratang Island, Shoal Bay creek, north of Port Blair and near Port Anson.

Tremors from the earthquake were felt (6) in cities along the Coromandel (eastern) coast of India and even in Colombo, Sri Lanka. In Madras (now Chennai), two tremors were felt, the first of 2 seconds and the second lasting 15 seconds. It was felt throughout the city, mostly by people in tall buildings. At some locations, doors and windows are reported to have "slammed with a bang" and "chairs rocked". Articles kept on shelves also fell onto the floor. The tremors in the city were reported to have been the strongest since 1899. At Vishakhapatnam, two shocks were experienced within two minutes. People went outdoors on feeling the tremors, as did employees at the Municipal buildings in the city, as they felt the buildings rocking. People outdoors are said to have had an "unusual experience". Tremors were also experienced at Calcutta (now Kolkata), Chandernagar and Cuttack. Shaking was felt for a duration of 4 minutes at Cuttack. Tremors were felt in Colombo, Sri Lanka for a few seconds and also at Syhlet, Bangladesh, where the Car Festival was suspended due to the quake. There are no reports of tremors being felt from Sumatera, Indonesia in June 1941.

The earthquake was followed by several powerful aftershocks (5). Two magnitude 6.0 events struck within 24 hours of the main shock on June 27th, 1941. The first occurred at 07:32:47 UTC and was followed by another at 08:32:19 UTC. These were then followed by 14 earthquakes of magnitude 6.0 upto January 1942.

A tsunami (1) was triggered by this earthquake in the Bay of Bengal. As per journalistic sources, the height of the tsunami was of the order of 0.75 to 1.25 meters. At the time no tidal gauge was in operation. Mathematical calculations suggest that the height could be of the order of 1.0 meter. This tsunami was witnessed along the eastern coast of India. It is believed that nearly 5,000 people were killed by the tsunami on the east coast of India. Local newspaper are believed to have mistaken the deaths and damage to a storm surge, however, a search of meteorological records (2) does not show any storm surge on that day on the Coromandel Coast. National dailies like the Times of India (6), which reported the quake's shaking effects did not mention any deaths, either as a result of a storm surge or a tsunami.
REFERENCES

1) International Tsunami Symposium.

2) Murty, T.S., "Storm surges - meteorological ocean tides", Bulletin of the Fisheries Research Board of Canada, Ottawa, 1984.

3) Pacheco, Javier F., and Sykes, Lynn R., "Seismic moment catalog of large shallow earthquakes, 1900 to 1989", Bulletin of the Seismological Society of America, v. 82, no. 3, p. 1306 - 1349, 1992.

4) Dasgupta, S., Pande, P., Ganguly, D., Iqbal, Z, Sanyal, K, Venkatraman, N.V., Dasgupta, S., Sural, B., Harendranath, L., Mazumdar, K., Sanyal, S., Roy, K., Das, L.K., Misra, P.S., Gupta, H.,  "Seismotectonic Atlas of India and its Environs", Geological Survey of India, 2000.

5) Tandon, A.N., and Srivastava, H.N., "Earthquake occurrence in India: Earthquake Engineering", Sarita Prakashan,  Jai Krishna Vol., 1-48, Meerut, 1974.

6) Times of India newspaper archives (Mumbai), India

1883 - Reports from Ceylon on the Tsunami
Reports on the Tsunami of 1883 in Sri Lanka

A series of three explosions on the morning of the 27 th of August 1883 aboit 05.28 local time in Krakatoa led to the destruction of Kraktoa's mountain peak and led to a tsunami that propagated across the Indian Ocean. Thereafter at 6.36 500 m high peak at Danan exploded and collapsed and the thrid blask tore the remaining part of Krakatau Island (Rakata Island) apart. The total energy released by the explosion was equivaled to 200 megatons atomic bombs (8.4 x 10E7 joules). At least 36,000 people were killed particularly in Java and Sumatra; wave heights rearched 15 to 42 meters.

In Sri Lanka (3113 km from Krakatau) two descriptions of the tsunami are avaialable:
At Galle:
"An extraordinary occurence was witnessed at the wharf at about 01:30 local time (15:30 Krakatau time). The sea receded as far as the landing stage on the jetty. The boats and canoes moored along the shored were left high and dry for about three minutes. A great number of prowans and fishes were taken up by the coolies and stragglers abbout the place before the water returned. Since the above was written, the sea has receded twice throught the harhour".
At Negombo at 03:00:
" the rise of the tide was so much above teh usual water-mark that many of the low morasses lying in close proximity to the seaside were replete with water that flowed into them. However the water thus accumulated did not remain long, but, foring into a stream, wended its course in a southerly direction, through low lands, to a distance of nearly a quarter of a mile, and found a passage back to the sea; thus the the water that had so abruptly covered up such an extent of land did not take many days in draining off"

"The receding waters were not slow behind in their action, for they washed away a belt of land about 132-198 feet (40-60m) in extent, including the burial ground situated on the coast to the south-west of teh bay compelling the inhabitants to seek shelter in a neighbouring cocoa-nut garden."

Sixteen recessions were counted between noon and 03:000 LT on 27 and rushing water produced what was described as a hissing sound. The crest height seems to have been more than 1 m. The wave reached Sri Lanka 5-7 hours after the earthquake.

At Arugam Bay in the Southeast:

"Three moorwomen, three children and a man were crossing the bar about 03:00 LT. A big wave came up from the sea and washed them inland. Soon after the water returned to the sea. The man said that the water came up to his chest: he isa tall man. These people were tumbling abou in the water, but were rescued by people in the Kalapuwa (inland estuary). They lost the paddy these were carrying and one of the women died two days after of her injusries.


Extracts as reported by
Choi, Pelinovsky, Kim and Lee, Simulation of the trans-oceanic tsunami propagation due to the 1883 Krakatau volcanic eruption. Natural Hazards and Earth System Sciences, 3:321-332, 2003. pdf


Indian Ocean Currents in the Equatorial Indian Ocean

Oceanography in the Indian Ocean

The seas aroung Sri Lanka serves as a choke point as the ocean is in effect bounded on the South by the monsoon induced equatorial jet. Around Sri Lanka, currents that come travel along the equator, those that come from open seas and those that are driven along the coasts of India, merge, clash and set off eddies and waves. The ocean current is driven from the Bay of Bengal to the Arabian Sea during the North-East monsoon and from the Arabian sea to the Bay of Bengal during the South-West monsoon. During the NE monsoon, the East Indian Coastal Current (EICC) travels down the East coast impelled by the monsoon winds and fed by the discharge of the Ganga and other rivers along the West Coast. These currents are particularly rapid when there is heavy rains or cyclones. During the South-West monsoon, the West Indian Coastal Current (WICC) travels down the West Coast. To the South of Sri Lanka, the Equatorial Monsoon Current (EMC) flows West and East during the South-West and North-East monsoons respectively.

The equatorial jet travels at around 1 m/s (Tomzack and Godrey, p 201-203) or around 3-4 km / hour. Indeed, this is much slower than the speed of the Tsunami of 500 km/hour. Perhaps, the currents themselves may not have a serious effect on Tsunami. However, the basin topography (see below), in the way it focusses  the energy of the tsunami may indeed have effected. In particular the 94 degree N-S ridge seems to have served as "reflector" of the Tsunami wave.

Figure caption: The ocean currents during the North-East and  South-West monsoons.

Indian Ocean Currents in June and January


The Monsoon System in the Indian Ocean:
Courtesy: Tomzack and Godfreys: Regional Oceanography

 Basin Topography of the Indian Ocean
Indian Ocean Topography

The Monsoon System in the Indian Ocean 
- from Regional Oceanography by Tomzack and Godfrey

The Equatorial Currents from Sumatra, past Sri Lanka to Somalia is brought out in this figure.


Monsoon System in the Indian Ocean


Disaster Preparedness Forecasting and Warning for Tsunamis
 see
Pararas-Carayannis George. TSUNAMI: FORECASTING. PREPAREDNESS AND WARNING, Fifteenth Conference on Broadcast Meteorology of the American Meteorological Society, April 9-12, 1985, Honolulu, Hawaii  and   http://www.drgeorgepc.com/TsunamiForecasting.html

TSUNAMI: FORECASTING. PREPAREDNESS AND WARNING

by George Pararas-Carayannis

Historical Background

Tsunamis are among the most terrifying natural hazards known to man and have been responsible for tremendous loss of life and property throughout history. Because of their destructiveness, tsunami have important impact on the human, social and economic sectors of our societies. In the Pacific Ocean where the majority of these waves have been generated, the historical record shows tremendous destruction. In Japan, which has one of the most populated coastal regions in the world and a long history of earthquake activity, tsunami have destroyed entire coastal populations. There is also a history of tsunami destruction in Alaska, in the Hawaiian Islands in South America and elsewhere in the Pacific, although the historic records for these areas do not go back sufficiently in time.
Historical records also document considerable loss of life and destruction of property on the western shores of the North and South Atlantic, the coastal regions of north-western Europe, and in the seismically active regions around the eastern Caribbean. Fortunately tsunami in the Atlantic and the Caribbean do not occur as frequently as in the Pacific.
Destructive tsunami have occurred also in the Indian Ocean and in the Mediterranean Sea. The most notable tsunami in the region of the Indian Ocean was that associated with the violent explosion of the volcanic island of Krakatoa in August 1883. A 30 meter (100 feet) tsunami resulting from this explosion killed 36,500 people in Java and Sumatra. The violent eruption and explosion of the volcano of Santorin, in the fifteenth Century B.C. generated a tremendous tsunami which destroyed most of the coastal Minoan settlements on the Aegean sea islands acting as the catalyst for the decline of the advanced Minoan civilization.

Japan is very vulnerable to the tsunami hazard. All the major Japanese islands have been struck by devastating tsunamis. A total of 68 destructive tsunami have struck Japan between A.D. 684 and 1984 with thousands of lives lost and with the destruction of-hundreds of villages. In this century alone, at least 6 major destructive tsunamis have hit Japan. On 3 March 1933 a tsunami in the Sanriku area reached a height of about 30 meters and killed over 3,000 people, injured hundreds more and destroyed approximately 9,000 homes and 8,000 boats. Other similarly destructive tsunami occurred in 1944, 1946, 1960, and in 1983. The 1983 event, although not very destructive in terms of lives lost and property damage, occurred in the Sea of Japan in an area not known before for seismic or tsunami activity.
In the Hawaiian islands, tsunami have struck repeatedly, causing great loss of life and immense damage to property. Most noteworthy of the recent Hawaiian tsunami is that of 1 April 1946 which inundated and destroyed the city of Hilo, killing 159 people. Other recent tsunami that have hit Hawaii occurred in 1952, 1957, 1960, 1964 and 1975. One of the most devastating recent tsunami was generated by a large earthquake in the Moro Gulf in the Philippines on 16 August 1976. The tsunami waves killed over 8,000 people in Mindanao, leaving 10,000 injured and 90,000 more homeless. In August 1977 a large earthquake in the Lesser Sunda Islands, Indonesia generated a destructive tsunami which killed hundreds of people on Lombok and Sumbawa Islands along the eastern side of the Indian Ocean. Another devastating tsunami occurred on 12 December 1979 in the south-west corner of Colombia destroying several fishing villages, taking the lives of hundreds of people and creating economic chaos in an already economically depressed region of that country. Many more events have occurred in the last twenty years.

Understanding Tsunami Source Mechanism and Potential Terminal Runup

Tsunamis are impulsively generated sea waves by a disturbance at or near the ocean. Earthquakes, submarine volcanic explosions, landslides and the detonation of nuclear devices near the sea can give rise to such destructive sea waves. By far the most destructive tsunamis are generated from large shallow-focus earthquakes with an epicenter or fault line near or in the ocean. Vertical displacements of the earth's crust along the rupture resulting from such earthquakes can generate destructive tsunami waves which can travel across an ocean spreading destruction across their path. Similar displacements of the ocean floor can also be produced by volcanic eruptions and submarine avalanches or landslides. However, these sources are considered as point sources and, although the tsunami waves generated can be very destructive locally, the energy of the waves is rapidly dissipated as they travel across the ocean.
To forecast tsunamis and determine terminal runup and destructiveness, one must be able to evaluate the parameters of the tsunami source mechanism in real time, often from inadequate data. Tsunami source mechanism analysis is difficult given the time constraints of a warning situation. It will suffice to say that forecasting the runup and potential destructiveness of a tsunami at a distant shore will depend greatly on determining the seismic parameters of the source location such as magnitude of the earthquake, its depth, its orientation, the length of the fault line, the size of the crustal displacements, and depth of the water. Refraction and diffraction processes will affect the energy and height of the tsunami waves as they travel across the ocean. These effects must also be determined. Finally, terminal height, run-up, and inundation of the tsunami at a point of impact will depend upon the energy focusing effect, th travel path of the waves, the coastal configuration, and the offshore bathymetry, only to name a few.
Tsunami run-up is the vertical distance between the maximum height reached by the water on shore and the mean-sea-level surface. Contrary to meteorological predictions, tsunami run-up, the final product of earthquake and tsunami investigations is not possible to forecast with a great degree of accuracy. The reason for this inadequacy is that the Tsunami Warning System works in a real time frame of short duration, often with inadequate data and information. Problems of communications and lack of sufficient station density, often complicate the process . Forecasting tsunamis requires adequate understanding of the phenomenon, good and expeditious collection of earthquake and sea level data, and accurate and expeditious assessment and interpretation of this data.

Preparedness and Planning
There is very little that can be done to prevent the occurrence of natural hazards. But while these natural disasters cannot be prevented, their results, such as loss of life and property, can be reduced by proper planning. Government agencies should formulate land-use regulations for a given coastal area with the tsunami risk potential in mind, particularly if such an area is known to have sustained damage in the past. Tsunami hazard perception by the people of a coastal area is necessary in mitigating loss of life and damage to property. Hazard perception by the public is based on a technical understanding of the phenomenon, at least at the basic level, and a behavioral response stemming from that understanding and confidence of the public for the authorities responsible for warning.
Over warning, based on inadequate data on which to base the prediction, often leads to false alarms and lack of compliance with warning and evacuation attempts. Such false alarms result in a loss of faith in the capability of a warning system and result in reluctance to take action in subsequent tsunami events.
Fortunately, forecasting of tsunami in recent years has been quite good and the image of the Tsunami Warning System and its credibility have improved considerably. Forecasting, however, is not an exact science as the phenomenon itself is very complex and data on which the forecast is based may often be inadequate for certain areas of the Pacific.

The International Tsunami Warning System
Following the disaster caused by the tsunami of 1 April 1946 in the Hawaiian Islands and elsewhere a rudimentary warning system was established in 1948 to provide watch and warning information to the civil authorities and various military headquarters in the Hawaiian Islands for dissemination to military bases throughout the Pacific and to islands in the Trust Territories. Beginning in October 1953 warning information was extended to California, Oregon and the State of Washington.
The great destruction caused by the May 1960 Chilean tsunami prompted a large number of countries and territories to Join the TWS. Another catastrophic tsunami generated by the great Alaskan earthquake of 1964 emphasized the need for an International Tsunami Warning System.
In 1965, the United Nations Educational Scientific and Cultural Organization's Intergovernmental Oceanographic Commission accepted the United States' offer to expand its existing Tsunami Center in Honolulu to become the Pacific Tsunami Warning Center (PTWC). Also established was an International Coordination Group (ICG/ITSU) and the International Tsunami Information Center (ITIC) to review and coordinate the activities of the International Tsunami Warning System for the Pacific (ITWS). The Pacific Tsunami Warning System has become the nucleus of a truly international system. Twenty-two nations are now members of ICG/ITSU. Several non-member stations and territories maintain stations for the ITWS. The present system makes use of twenty-four seismic stations, fifty-three tide stations and 101 dissemination points scattered throughout the Pacific Basin under the varying control of the Member States. PTWC in Honolulu, operated by the U.S. National Weather Service, Pacific Region, is the operational Center for the System.
Functioning of the system begins with the detection by any participating seismic observatory of an earthquake of sufficient size to trigger the alarms, set at the threshold of 6.5 on the Richter Scale. PTWC collects the seismic data, locates the earthquake and computes its magnitude. When reports from tide stations show that a tsunami has been generated which poses a threat to the population in part or all of the Pacific, a warning is transmitted to the dissemination agencies for relaying to the public. The agencies then implement predetermined plans to evacuate people from endangered areas. In addition to the International Tsunami Warning System, a number of Regional Warning Systems have been established to warn the population in areas where tsunami frequency is high and where immediate response is necessary. Such regional tsunami warning systems have been established in the Soviet Union, Japan, Alaska and Hawaii.


Deep-ocean Assessment and Reporting of Tsunamis (DART): Brief Overview and Status Report

F. I. González1, H.B. Milburn1, E.N. Bernard1, J. Newman2


1Pacific Marine Environmental Laboratory / NOAA
Seattle, WA 98115

2Joint Institute for the Study of the Atmosphere and Ocean / U. Washington
Seattle, WA 98195


Abstract
As part of the U.S. National Tsunami Hazard Mitigation Program, the DART Project is an effort by the Pacific Marine Environmental Laboratory of the National Oceanic and Atmospheric Administration to develop a capability for real-time reporting of tsunami measurements in the deep ocean. The systems utilize bottom pressure recorders (BPRs) capable of detecting and measuring tsunamis with amplitude as small as 1 cm in 6000 m of water. The data are transmitted by acoustic modem to a surface buoy, which then relays the information to a ground station via satellite telecommunications. This concept has been proven through several deep ocean deployments of prototype systems that provided extended periods of excellent data return. Design improvements in the next generation of systems will reduce the high data losses experienced during other periods. A planned network of six buoys in the north Pacific and equatorial region focuses on the hazard to U.S. coastal communities. Once this technology matures, consideration should be given to a coordinated international effort to establish additional stations of direct benefit to other Pacific Rim countries.

Full article


Surviving a Tsunami—Lessons from Chile, Hawaii, and Japan

This 18-page booklet was originally published in paper by the U.S. Geological Survey and is now available here as a PDF document. It contains lessons on how to survive a tsunami based on accounts from people who survived the tsunami generated by the largest earthquake ever measured—the magnitude 9.5 earthquake in Chile on May 22, 1960. It also contains an excellent description of what tsunamis are.

This project was sponsored by The National Tsunami Hazard Mitigation Program. The booklet was prepared in cooperation with Universidad Austral de Chile, the University of Tokyo, the University of Washington, the Geological Survey of Japan, and the Pacific Tsunami Museum.


Download a PDF version of this report (15.7 MB)


Websites Providing Information
Lareef's website
Lareef's Blog
Geolanka
Recoverlanka
www.climate.lk
Servesrilanka
United States Geological Service
Tsunami.org
Science of Tsunami Hazards Journal
Sri Lanka Disasters
ISDR - International Strategy for Disaster Reduction Platform for Early Warning
Pacific Tsunami Warning Center
Tsunami Links
Indian Ocean Earthquake from Wikipedia
Amateur Seismic Network